Apply Fibonacci Trend Lines
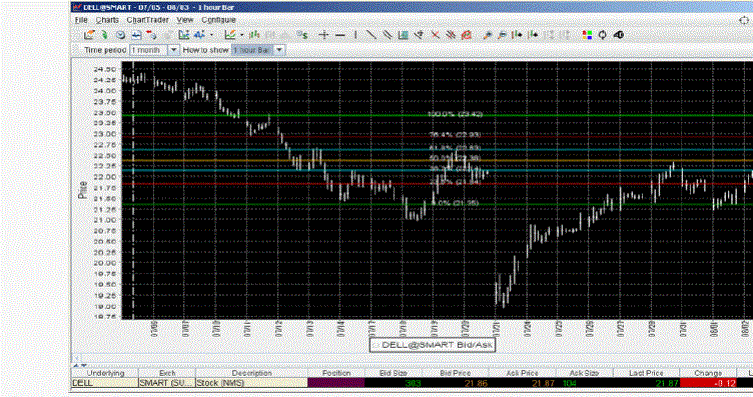
The Fibonacci trendlines may be used to help determine price support/resistance at or near certain levels. The Fibonacci lines occur at 0.0%, 23.6%, 38.2%, 50.0%, 61.8%, 76.4% and 100.0%. Retracements occurring at these points within a trend could be used to help determine entry and exit points for a contract.

To add Fibonacci lines to a chart
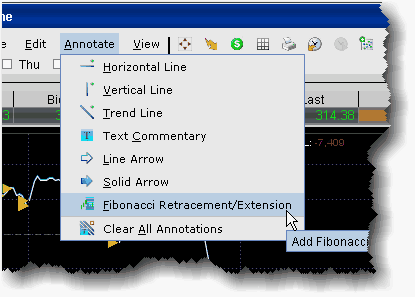
- From within a chart, use the Annotate menu to select Fibonacci Retracement/Extension.
- Click your mouse at a peak or low point in the chart and pull to down/up and to the right across the chart.
- A series of seven colored trendlines are drawn at 0.0%, 23.6%, 38.2%, 50.0%, 61.8%, 76.4% and 100.0%.

To delete a Fibonacci series of trendlines
- Click the Remove All Trendlines icon, located three icons to the right from the Add Fibonacci Line icon.